
Roy Moore literally rides in on a horse to vote:
WATCH: Alabama Senate candidate Roy Moore arrives to vote on horseback pic.twitter.com/crp2cfsfNA
— NBC News (@NBCNews) December 12, 2017
Moore’s final event/rally last night included a speaker who said he and Moore accidentally went to a brothel with child prostitutes, and a speech by his wife addressing charges of antisemitism with “We have a lawyer who is a JEEEEeeeeew.” Also present: Steve Bannon, Representative Louie Gohmert, Sheriff David Clarke, a woman performing an interpretive dance in front of a tree, and several inflatable alligators.
Nobody has any idea on who is going to win. The polls are generally useless and all over the place, but much will depend (I believe) on turnout.
Here’s another take:
To win #ALSEN (@CookPolitical PVI R+14), Jones needs:
1) Ridiculous Dem margins in Birmingham/Montgomery
2) Strong crossover from college whites in Huntsville/Shelby
3) Not much drop-off from ’16 turnout in Black Belt
4) Weak/typical off year turnout among non-college whites— Dave Wasserman (@Redistrict) December 12, 2017
Alabama Senate Race Benchmarks by County – December 12, 2017 |
If either candidate is consistently exceeding these targets as counties report votes, he’s on track to win. |
||||
Created by: David Wasserman, Cook Political Report |
Twitter: @Redistrict |
||||
Locality |
Jones Vote Goal |
Moore Vote Goal |
Dem 2-Party Share |
GOP 2-Party Share |
Dem/GOP Break-Even Margin |
| Autauga County | 6,244 | 10,168 | 38.0% | 62.0% | -23.9% |
| Baldwin County | 20,357 | 40,703 | 33.3% | 66.7% | -33.3% |
| Barbour County | 5,185 | 3,052 | 62.9% | 37.1% | 25.9% |
| Bibb County | 2,007 | 3,782 | 34.7% | 65.3% | -30.7% |
| Blount County | 3,182 | 12,823 | 19.9% | 80.1% | -60.2% |
| Bullock County | 3,420 | 638 | 84.3% | 15.7% | 68.6% |
| Butler County | 3,806 | 2,748 | 58.1% | 41.9% | 16.1% |
| Calhoun County | 14,237 | 18,414 | 43.6% | 56.4% | -12.8% |
| Chambers County | 5,984 | 4,397 | 57.6% | 42.4% | 15.3% |
| Cherokee County | 2084 | 5020 | 29.3% | 70.7% | -41.3% |
| Chilton County | 3,324 | 8,458 | 28.2% | 71.8% | -43.6% |
| Choctaw County | 3254 | 2,304 | 58.5% | 41.5% | 17.1% |
| Clarke County | 5,499 | 4,004 | 57.9% | 42.1% | 15.7% |
| Clay County | 1,592 | 2,945 | 35.1% | 64.9% | -29.8% |
| Cleburne County | 949 | 3,236 | 22.7% | 77.3% | -54.6% |
| Coffee County | 5,050 | 8,875 | 36.3% | 63.7% | -27.5% |
| Colbert County | 8,401 | 9,376 | 47.3% | 52.7% | -5.5% |
| Conecuh County | 3038 | 1920 | 61.3% | 38.7% | 22.5% |
| Coosa County | 1,916 | 1,897 | 50.2% | 49.8% | 0.5% |
| Covington County | 3,119 | 7,437 | 29.5% | 70.5% | -40.9% |
| Crenshaw County | 1,842 | 2,532 | 42.1% | 57.9% | -15.8% |
| Cullman County | 5,395 | 18494 | 22.6% | 77.4% | -54.8% |
| Dale County | 5,032 | 7,732 | 39.4% | 60.6% | -21.2% |
| Dallas County | 12,343 | 3,245 | 79.2% | 20.8% | 58.4% |
| DeKalb County | 4,927 | 12,013 | 29.1% | 70.9% | -41.8% |
| Elmore County | 8,970 | 15,458 | 36.7% | 63.3% | -26.6% |
| Escambia County | 4,883 | 5,572 | 46.7% | 53.3% | -6.6% |
| Etowah County | 11,946 | 18,128 | 39.7% | 60.3% | -20.6% |
| Fayette County | 1698 | 3766 | 31.1% | 68.9% | -37.8% |
| Franklin County | 2961 | 5,308 | 35.8% | 64.2% | -28.4% |
| Geneva County | 1,996 | 5,607 | 26.3% | 73.7% | -47.5% |
| Greene County | 3,784 | 470 | 89.0% | 11.0% | 77.9% |
| Hale County | 4,599 | 1,779 | 72.1% | 27.9% | 44.2% |
| Henry County | 2804 | 3,155 | 47.1% | 52.9% | -5.9% |
| Houston County | 11,895 | 17,193 | 40.9% | 59.1% | -18.2% |
| Jackson County | 5,419 | 9348 | 36.7% | 63.3% | -26.6% |
| Jefferson County | 144,162 | 75,122 | 65.7% | 34.3% | 31.5% |
| Lamar County | 1,502 | 3,269 | 31.5% | 68.5% | -37.0% |
| Lauderdale County | 11,994 | 15,602 | 43.5% | 56.5% | -13.1% |
| Lawrence County | 4,544 | 6,077 | 42.8% | 57.2% | -14.4% |
| Lee County | 20,660 | 19,299 | 51.7% | 48.3% | 3.4% |
| Limestone County | 9,849 | 16,254 | 37.7% | 62.3% | -24.5% |
| Lowndes County | 4,863 | 980 | 83.2% | 16.8% | 66.5% |
| Macon County | 7,563 | 802 | 90.4% | 9.6% | 80.8% |
| Madison County | 59,758 | 49,858 | 54.5% | 45.5% | 9.0% |
| Marengo County | 5,373 | 2,929 | 64.7% | 35.3% | 29.4% |
| Marion County | 2,138 | 6,330 | 25.2% | 74.8% | -49.5% |
| Marshall County | 6500 | 16375 | 28.4% | 71.6% | -43.2% |
| Mobile County | 70,811 | 53,193 | 57.1% | 42.9% | 14.2% |
| Monroe County | 4,259 | 3,251 | 56.7% | 43.3% | 13.4% |
| Montgomery County | 55,434 | 18,941 | 74.5% | 25.5% | 49.1% |
| Morgan County | 13,178 | 20,972 | 38.6% | 61.4% | -22.8% |
| Perry County | 3,848 | 788 | 83.0% | 17.0% | 66.0% |
| Pickens County | 3,852 | 3,061 | 55.7% | 44.3% | 11.4% |
| Pike County | 5,516 | 4,298 | 56.2% | 43.8% | 12.4% |
| Randolph County | 2,789 | 4,323 | 39.2% | 60.8% | -21.6% |
| Russell County | 9,048 | 5,163 | 63.7% | 36.3% | 27.3% |
| Shelby County | 23,420 | 40,669 | 36.5% | 63.5% | -26.9% |
| St. Clair County | 6,012 | 17,741 | 25.3% | 74.7% | -49.4% |
| Sumter County | 4,599 | 883 | 83.9% | 16.1% | 67.8% |
| Talladega County | 12253 | 11559 | 51.5% | 48.5% | 2.9% |
| Tallapoosa County | 5,856 | 7,613 | 43.5% | 56.5% | -13.0% |
| Tuscaloosa County | 30,058 | 26,642 | 53.0% | 47.0% | 6.0% |
| Walker County | 6,107 | 13,618 | 31.0% | 69.0% | -38.1% |
| Washington County | 2591 | 3,394 | 43.3% | 56.7% | -13.4% |
| Wilcox County | 4,118 | 975 | 80.9% | 19.1% | 61.7% |
| Winston County | 1,357 | 5,176 | 20.8% | 79.2% | -58.5% |
| Statewide | 737,154 | 737,154 | 50.0% | 50.0% | 0.0% |
The question at stake? Who do Republicans hate more: Pedophiles or Democrats?
The answer might surprise you.
And should the election be close, we have a problem. No paper trail:
On Monday, a judge ordered local election officials to save digital images of ballots, AL.com reports. However, his decision was quickly reversed by the Alabama Supreme Court, which stayed his order Monday evening.
Alabama uses paper ballots in its elections, which is considered more secure than many digital voting machines. Once voters mark their choices on paper, the ballots are scanned by computers to tally the votes. This system isn’t set up properly for audits, according to Verified Voting, an election integrity organization.
“If the race goes to a recount following the election, Alabama’s recount laws won’t do enough to protect voters’ votes because it has no audit structure in place and relies on re-tabulation—where ballots that were tabulated by optical scanners are now re-tabulated by machine,” Verified Voting president Marian Schneider said in a statement. “If a recount occurs, it cannot be relied on to detect and correct a potential error in the computerized count unless it is done manually.”
Four Alabama voters sued in an effort to get ballot images preserved, according to AL.com, arguing that state and federal law requires election officials to preserve the digital ballot images for six months. In Alabama, the digital images are typically destroyed after an election.
“After hearing arguments and reviewing the filings, it appears that Plaintiffs and similarly situated voters would suffer irreparable and immediate harm if digital ballot images are not preserved,” Montgomery County Circuit Judge Roman Ashley Shaul wrote in his order requiring ballot images to be preserved.
However, the state Supreme Court overruled his decision, which Verified Voting says will limit the state’s ability to do election audits or catch hacking attempts.
“If every state’s election systems provided voter-verified paper ballots and post-election audits, we would be able to detect and correct errors or election tampering. But without the proper procedures in place, Alabama will be unable to do this,” Schneider said.
Meanwhile, in Trumpland, the swamp is getting deeper:
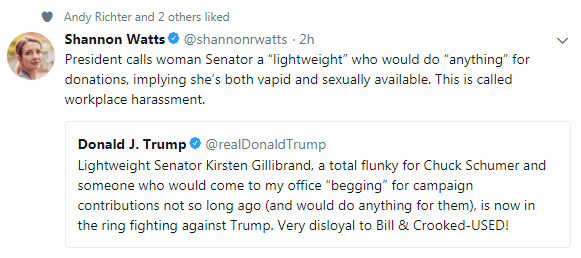
“Begging”? “Would do anything?” What is Trump insinuating?